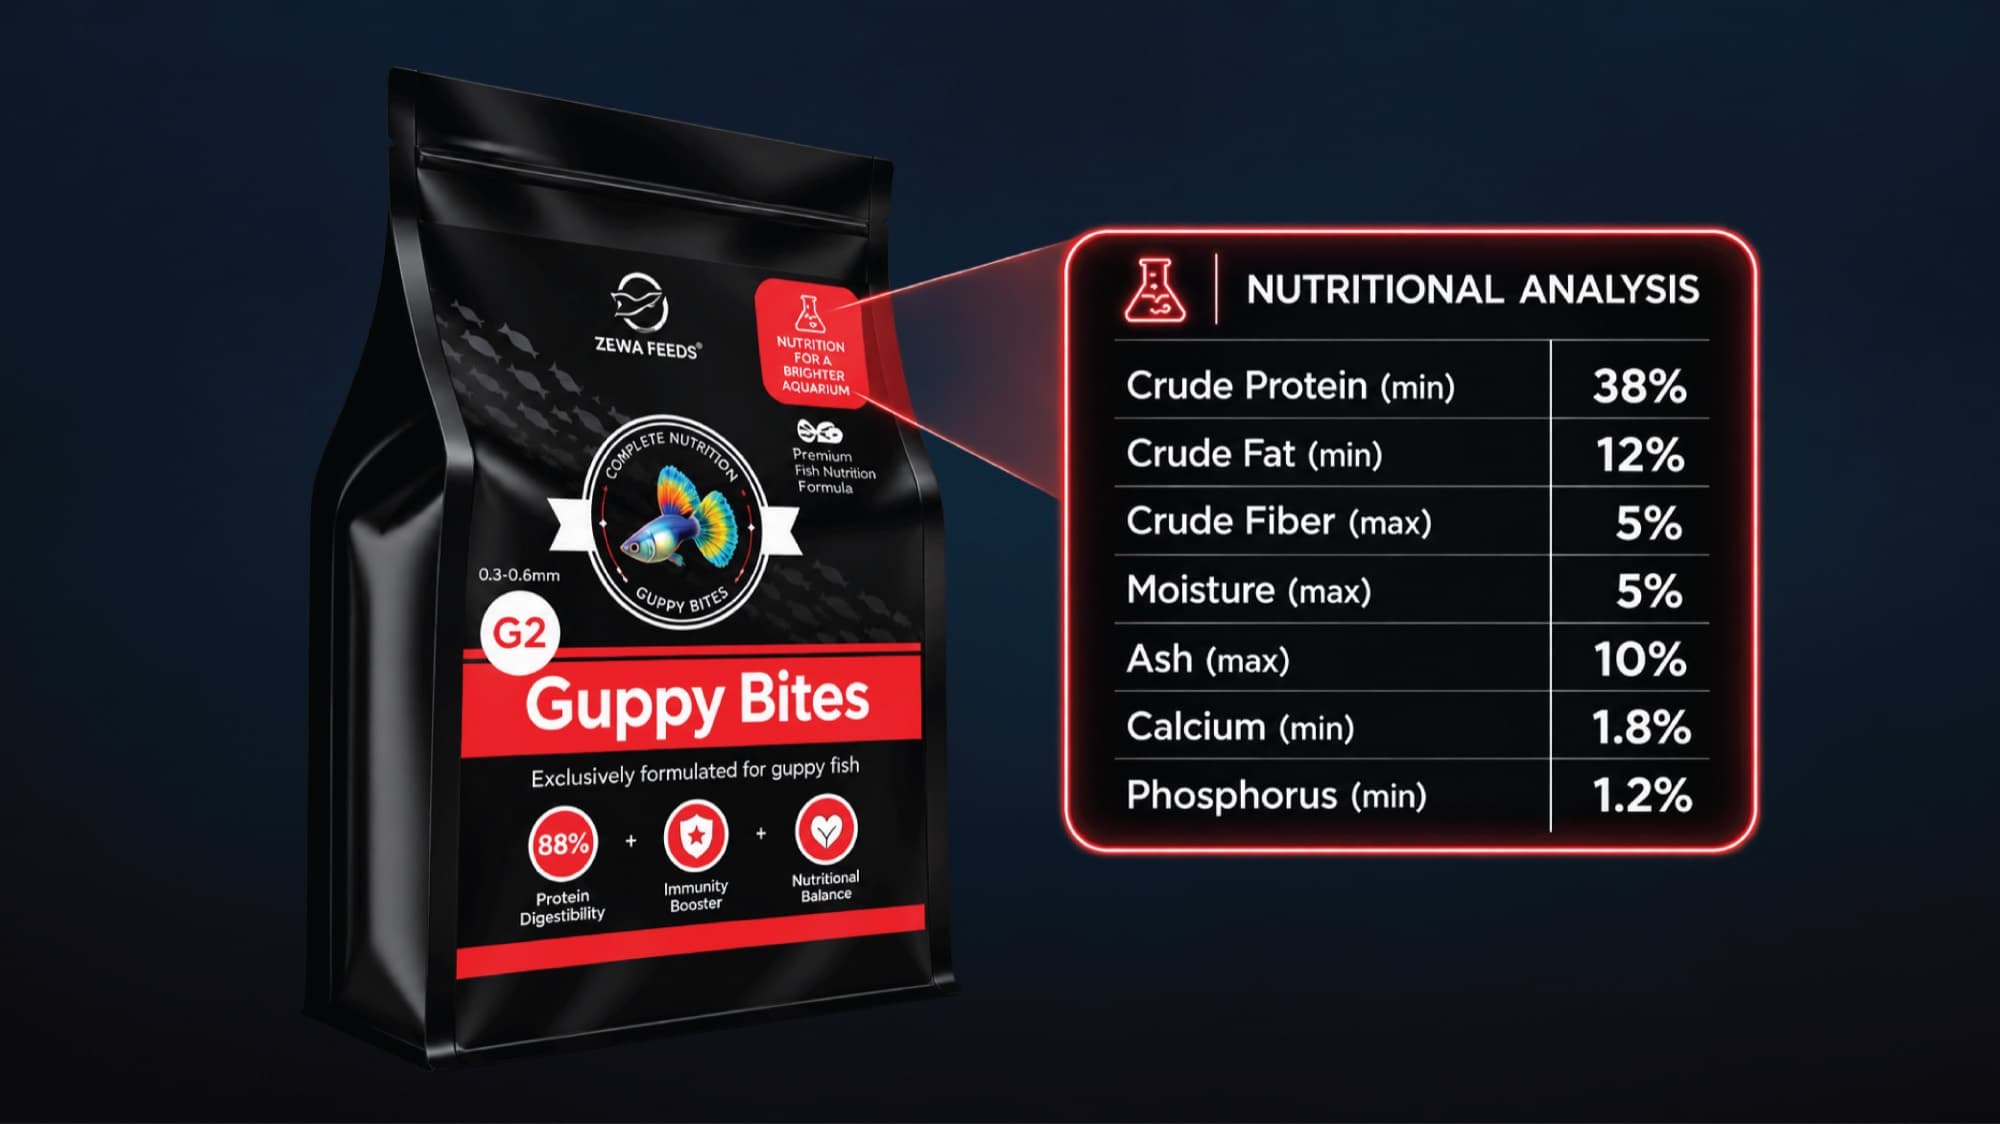
Two ornamental fish feeds can both declare 40% crude protein and produce different rates of growth in the same species. The declared figure is identical; the nutritional outcome is not.
Crude protein is the value most aquarists compare when choosing a feed. It measures the nitrogen content of a feed. It does not describe what that protein is composed of, or how much of it the fish can absorb. This post covers what the figure measures, what it omits, and which values are worth reading alongside it. It follows our comparison of fish meal, soy and insect protein as raw ingredients, and examines how those differences appear, or fail to appear, on the label.
What crude protein on a fish food label actually measures
Crude protein is not measured directly. Laboratories measure total nitrogen in a sample, usually by the Kjeldahl or Dumas method, then multiply that figure by a conversion factor to arrive at a protein percentage. The standard factor is 6.25, based on the assumption that protein is approximately 16% nitrogen by weight [3].
That assumption is a generalisation, and it carries two consequences.
The term “crude” is therefore accurate. The figure is an estimate derived from elemental nitrogen, not a direct measurement of protein.
Fish do not have a protein requirement, they have an amino acid requirement
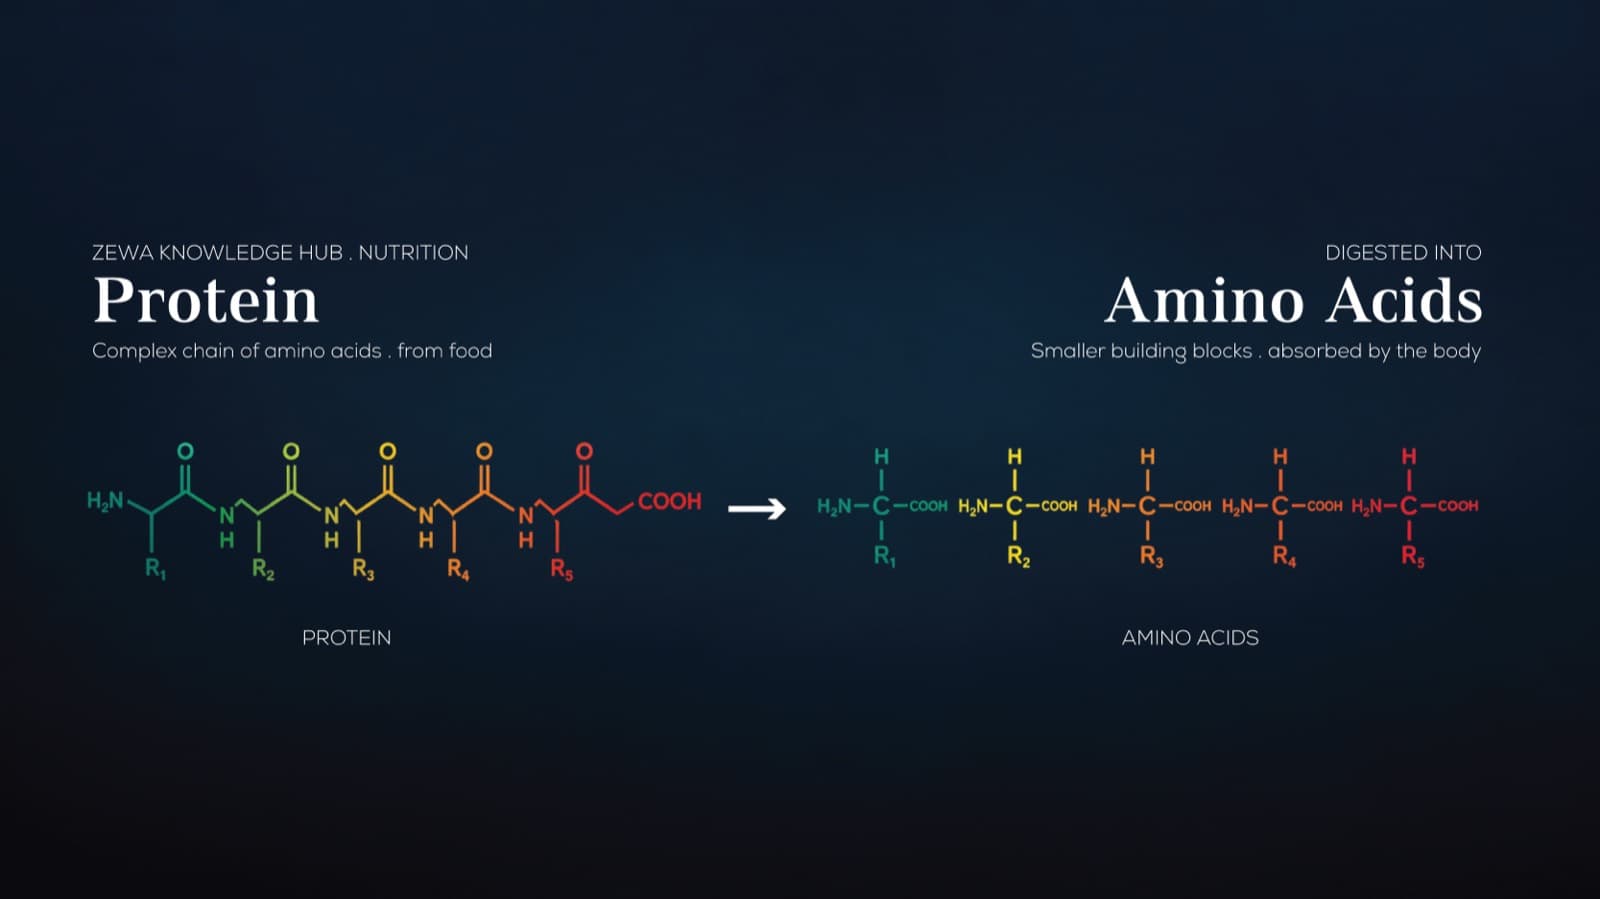
Protein is digested into amino acids before it is absorbed. What the fish requires is a supply of specific amino acids in the correct proportions. Ten of these are considered essential for fish, meaning they cannot be synthesised at a rate that meets demand and must come from the diet: methionine, arginine, threonine, tryptophan, histidine, isoleucine, lysine, leucine, valine and phenylalanine [1].
A feed can be high in nitrogen and still be a poor amino acid match for the species consuming it. The crude protein figure is unchanged in either case, because nitrogen analysis does not resolve amino acid balance.
The limiting amino acid sets the ceiling
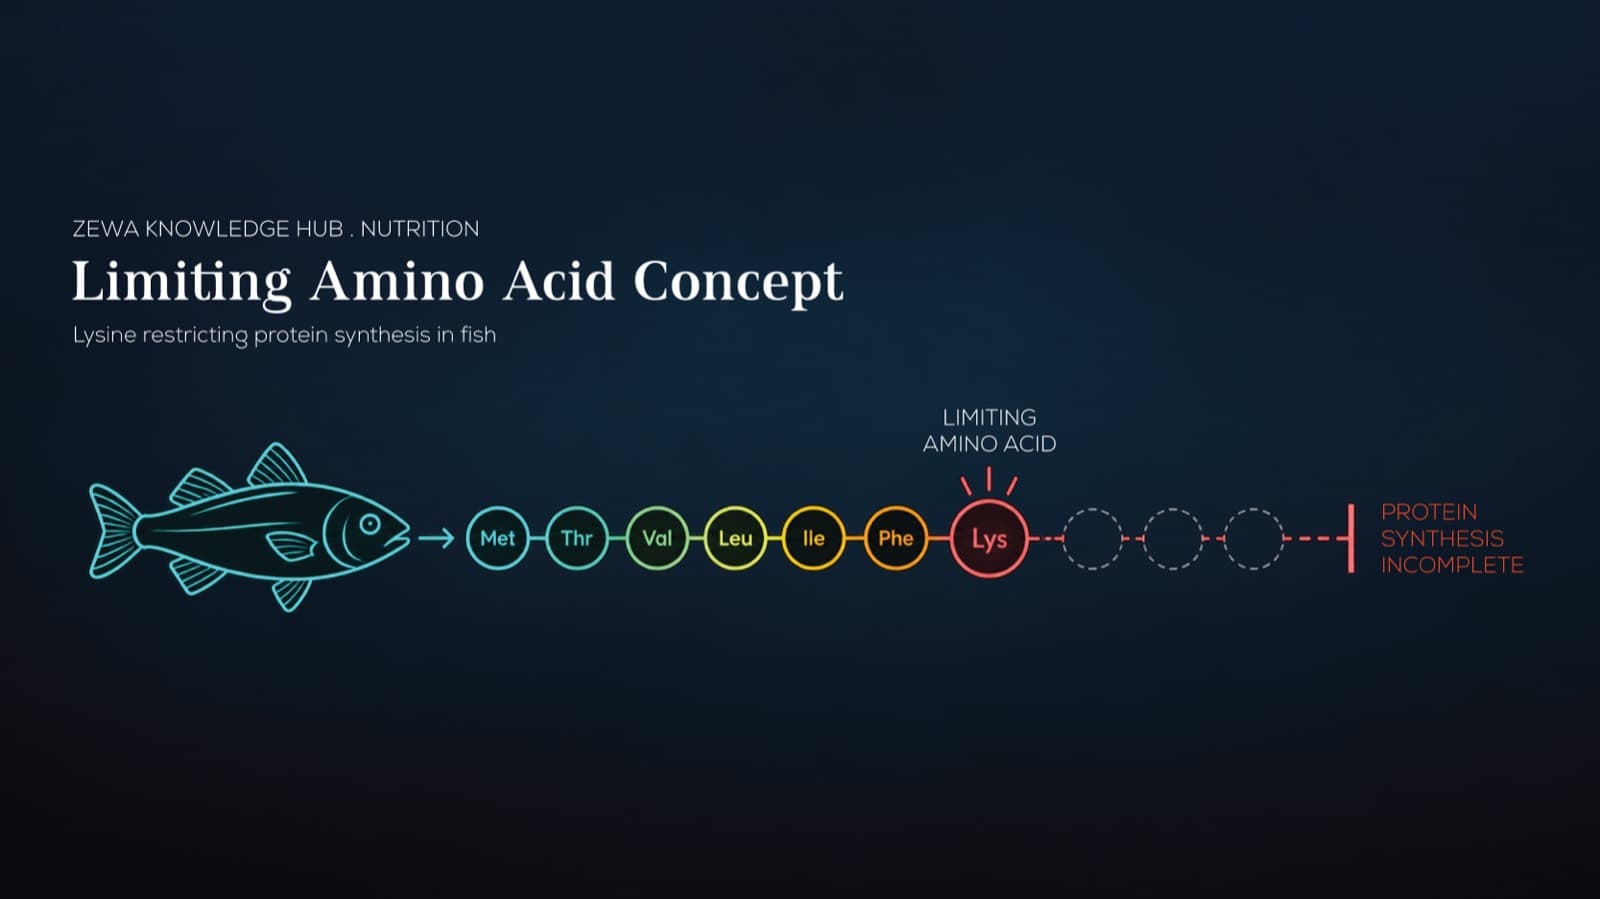
Protein synthesis proceeds only as far as the amino acid in shortest supply allows. Once that amino acid is depleted, synthesis stops regardless of the quantity of the others remaining. That amino acid is termed the limiting amino acid, and the surplus of the remainder is deaminated and excreted rather than incorporated into tissue [2,4].
Lysine and methionine are the two most commonly limiting amino acids in fish feed. Plant proteins such as soybean meal are typically low in methionine [1], and lysine is generally the first limiting amino acid in plant-protein-based aquafeeds, which is why it is used as the reference point in ideal protein formulation [2].
Correcting the amino acid balance can allow a feed with lower crude protein to outperform one with higher crude protein, while producing less nitrogenous waste.
This has a practical consequence. Correcting the amino acid balance can allow a feed with lower crude protein to outperform one with higher crude protein, while producing less nitrogenous waste, because less surplus protein is deaminated and excreted [2].
Why crude protein is not comparable across ingredient types
The declared percentage says nothing about the source behind it. Protein from different raw materials differs in amino acid profile and in the proportion a fish can digest and absorb, and meeting a species requirement depends on digestible amino acids rather than total ones, because no animal utilises everything it consumes [2].
A feed built on a highly digestible protein with a complete amino acid profile therefore delivers more usable protein per declared percentage point than one built on a source that is poorly matched or poorly absorbed. Two feeds declaring 40% are equivalent only if the protein behind the number is equivalent, and the label does not indicate whether it is.
Crude protein and protein quality at a glance
| Crude protein (%) | Protein quality | |
|---|---|---|
| Measures | Total nitrogen, converted to a protein figure | Amino acid composition and absorbable fraction |
| Method | Kjeldahl or Dumas nitrogen analysis | Amino acid profiling; digestibility assay |
| On the label | Yes, declared as “Crude Protein (min)” | Rarely, not usually required |
| Blind spot | Counts non-protein nitrogen; cannot see balance | Requires separate, costlier testing |
What to read alongside the crude protein figure
Crude protein remains a necessary declaration, and a 46% feed and a 28% feed are formulated for different animals. It is one input rather than a complete answer. Three further values are worth checking.
The ingredient list, in order
Ingredients are declared in descending order by weight. The first three positions indicate where the protein originates, which in turn indicates the likely amino acid profile behind the figure.
Species suitability
A 46% protein feed is appropriate for a carnivorous betta and unsuitable for a goldfish, which lacks a true stomach. A higher figure is not inherently better; a matched figure is.
Digestibility, where published
Only absorbed protein contributes to growth. Digestibility testing measures the fraction a fish can break down and take up, which is the gap crude protein cannot close. Few ornamental feed brands publish a digestibility figure. Zewa feeds are tested through an NABL accredited laboratory, and the insect protein base has been assessed at 88% pepsin digestibility.
Frequently asked questions
No. The appropriate level depends on the species, its digestive anatomy and its life stage. Protein supplied beyond what the fish can use is deaminated and excreted as ammonia, increasing the waste load without a corresponding benefit [2].
Crude protein does not describe amino acid balance or digestibility. If one feed is deficient in a limiting amino acid such as lysine or methionine, growth is constrained at that point irrespective of the declared figure.
It signals that the value is an estimate calculated from total nitrogen rather than a direct measurement of protein. Any non-protein nitrogen present in the sample is included in the result [3].
The takeaway
Crude protein reports the nitrogen content of a feed. It does not identify which amino acids that nitrogen represents, whether the profile matches the species, or what proportion is absorbed rather than excreted. Those three factors determine growth, colouration and waste load, and none of them appear on the label.
References
- 1
Craig, S., Helfrich, L.A., Kuhn, D.D. & Schwarz, M.H. Understanding Fish Nutrition, Feeds, and Feeding. Virginia Cooperative Extension, Publication 420-256 (FST-269P). View source
- 2
Miles, R.D. & Chapman, F.A. The Concept of Ideal Protein in Formulation of Aquaculture Feeds. UF/IFAS Extension, FA144. View source
- 3
Mæhre, H.K., Dalheim, L., Edvinsen, G.K., Elvevoll, E.O. & Jensen, I.-J. (2018). Protein Determination—Method Matters. Foods, 7(1):5. View source
- 4
Tacon, A.G.J. The Nutrition and Feeding of Farmed Fish and Shrimp: A Training Manual — The Essential Nutrients. FAO. View source

